Explore: The first steps with a new pattern (e.g., get info you need, take stock, smell checks).
Understand: Learning anything can involve asking questions (what kinds? How to actually translate to code? Interpreting outputs personally, may lead to more exploration).
Explain: How do we take the answers and rationalize with the investigations? That’s covered in this pattern. How to document to oneself, programmatic text for resilient reporting. This is really about talking to yourself, in a way.
Share: Communication and collaboration. We’ll show you ways you can make everything presentable and create outputs in a format that allows for easy consumption and feedback. An example: reordering plots or tables to make them easier to interpret.
There will always be a next time. This statement very much holds true when it comes to routinely loading in data for analysis. This variation of data loading is different from the first time, where you have no familiarity with the data at hand. Rather, this is data that perhaps comes in regularly (through updates) and the structure of it doesn’t really change (or at least, it shouldn’t).
This pattern is really different because we’re not coming to grips with what the data is. It’s a known quantity by now and so the concerns are different. One of these is: “Will this updated dataset work with my existing scripts and workflows?”. Typically, a workflow will adapt or scale with data that’s an expansion of earlier, working data (in a similar fashion to subsets of data). So the main concern is less about understanding the data and generating the workflows around the data but ensuring that data quality is maintained with subsequent updates.
We’ll need a few packages loaded in for this chapter:
tidyverse: for various functions across a collection of packages (the Tidyverse packages)
intendo: for the dataset we’ll be using (user_summary)
pointblank: for building a data dictionary and performing data checks
6.1 Explore
Before we dive right in and look at a messed up table (full of data quality issues) let enumerate the types of data quality problems that happen on a regular basis.
Missing Values
Missing values occur when there are empty or null entries in the data. Missing values can lead to biased or incomplete analysis since they can introduce inconsistencies and distort statistical calculations. Analysts may need to handle missing values appropriately by imputing them or excluding them from the analysis, depending on the context.
Inconsistent Formatting
Inconsistent formatting refers to variations in how data is represented, such as inconsistent date formats or inconsistent capitalization. Inconsistent formatting can make data difficult to analyze, compare, or merge across different datasets. It can also lead to errors in calculations or misinterpretations of the data.
Duplicates
Duplicates occur when there are multiple identical or similar entries in the dataset. Duplicates can distort statistical analysis, as they may artificially inflate counts, averages, or other summary metrics. They can also lead to incorrect conclusions or duplicate efforts if not properly identified and handled.
Outliers
Outliers are extreme values that deviate significantly from the majority of the data. Outliers can have a disproportionate impact on statistical measures, potentially skewing results or leading to incorrect assumptions. Analysts need to identify and evaluate outliers to determine their validity and decide whether to include, transform, or remove them from the analysis.
Inaccurate or Incomplete Data
Inaccurate or incomplete data refers to data that contains errors, inaccuracies, or omissions. This can include data entry errors, measurement errors, or incomplete records. Inaccurate or incomplete data can lead to incorrect analysis, biased conclusions, or unreliable insights. It is crucial for analysts to validate and verify data quality and address any inaccuracies or incompleteness before drawing conclusions.
This is just a sampling of data quality issues someone dealing with data might face. Data quality issues are straight up problematic for data people. These problems harm the integrity, reliability, and validity of analytical outcomes. This potentially leads to: (1) erroneous insights, (2) biased decision-making, and (3) flawed conclusions; three things which are pretty much the same w.r.t. badness and unwantedness. It is imperative, crucial even, to address data quality problems. This is done of course with data validation, and appropriate handling to safeguard the accuracy and dependability of analyses (and those decision-making processes).
Now to the data. We’re going to get that data from the intendo package. This data package contains synthetic datasets and it comes from the videogame analytics world. One thing that’s really hard to find is data that is purposefully full of errors. The intendo package has these kind of datasets and, additionally, the errors are fully documented (in the package codebase, that is). But don’t cheat and take a look just yet! We need to discover what the problems are through data quality checks.
The dataset we are going to use for our data-quality-checking examples is called user_summary and we can access it (and choose the "faulty" variant) through intendo’s user_summary() function.
user_summary<-user_summary(quality ="faulty")
Let’s look at the faulty user_summary table using dplyr’s glimpse() function:
This dataset, unlike the previously used stickers dataset, has no weirdness with regard to overly-long column names or the like. The major malfunction here is the data itself: it’s faulty. We obviously can’t see that in the glimpse() of the data but it’s there. We have to deal with this using a high amount of data quality checks. Small errors can easily creep in and cause small to huge problems with your analysis, so, this is super important!
Let’s look at the data and what it means. The intendo package smartly provides data dictionaries for each of its datasets. We can view the data dictionary for the user_summary table with the user_summary_dd() function.
user_summary_dd()
That data dictionary is pretty detailed! It doesn’t provide sample values for any column, but, it does describe the data reasonably well (especially the player_id column). This should be read over at least twice and then, once we have a solid understanding of the data again (supposing we’ve seen this data before) we can then get to exploring the data again and building some data quality checks we can always run when we get refreshed data.
6.2 Explore
Let’s use scan_data() to look at the user_summary table. In this case, we only want to look at a few sections of the full data scan.
scan_data(user_summary, sections ="OVMS")
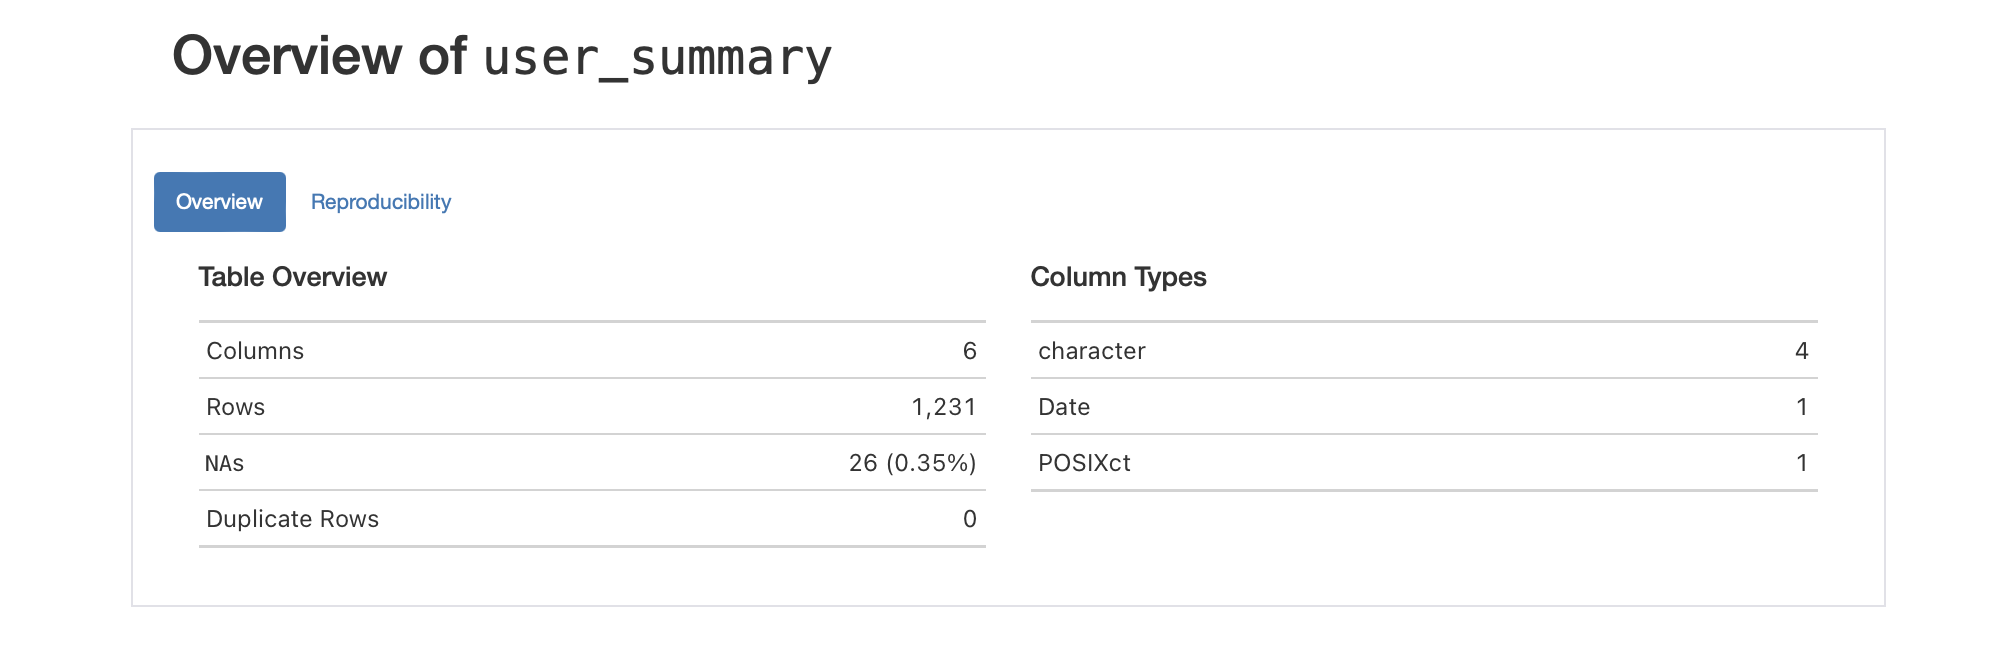
The table is not supposed to have missing values, but this version of user_summary has 26 of them. That bit of information is shown in the Table Overview section of the table scan.
Part of the table scan, where we get an overview of the table and its columns.
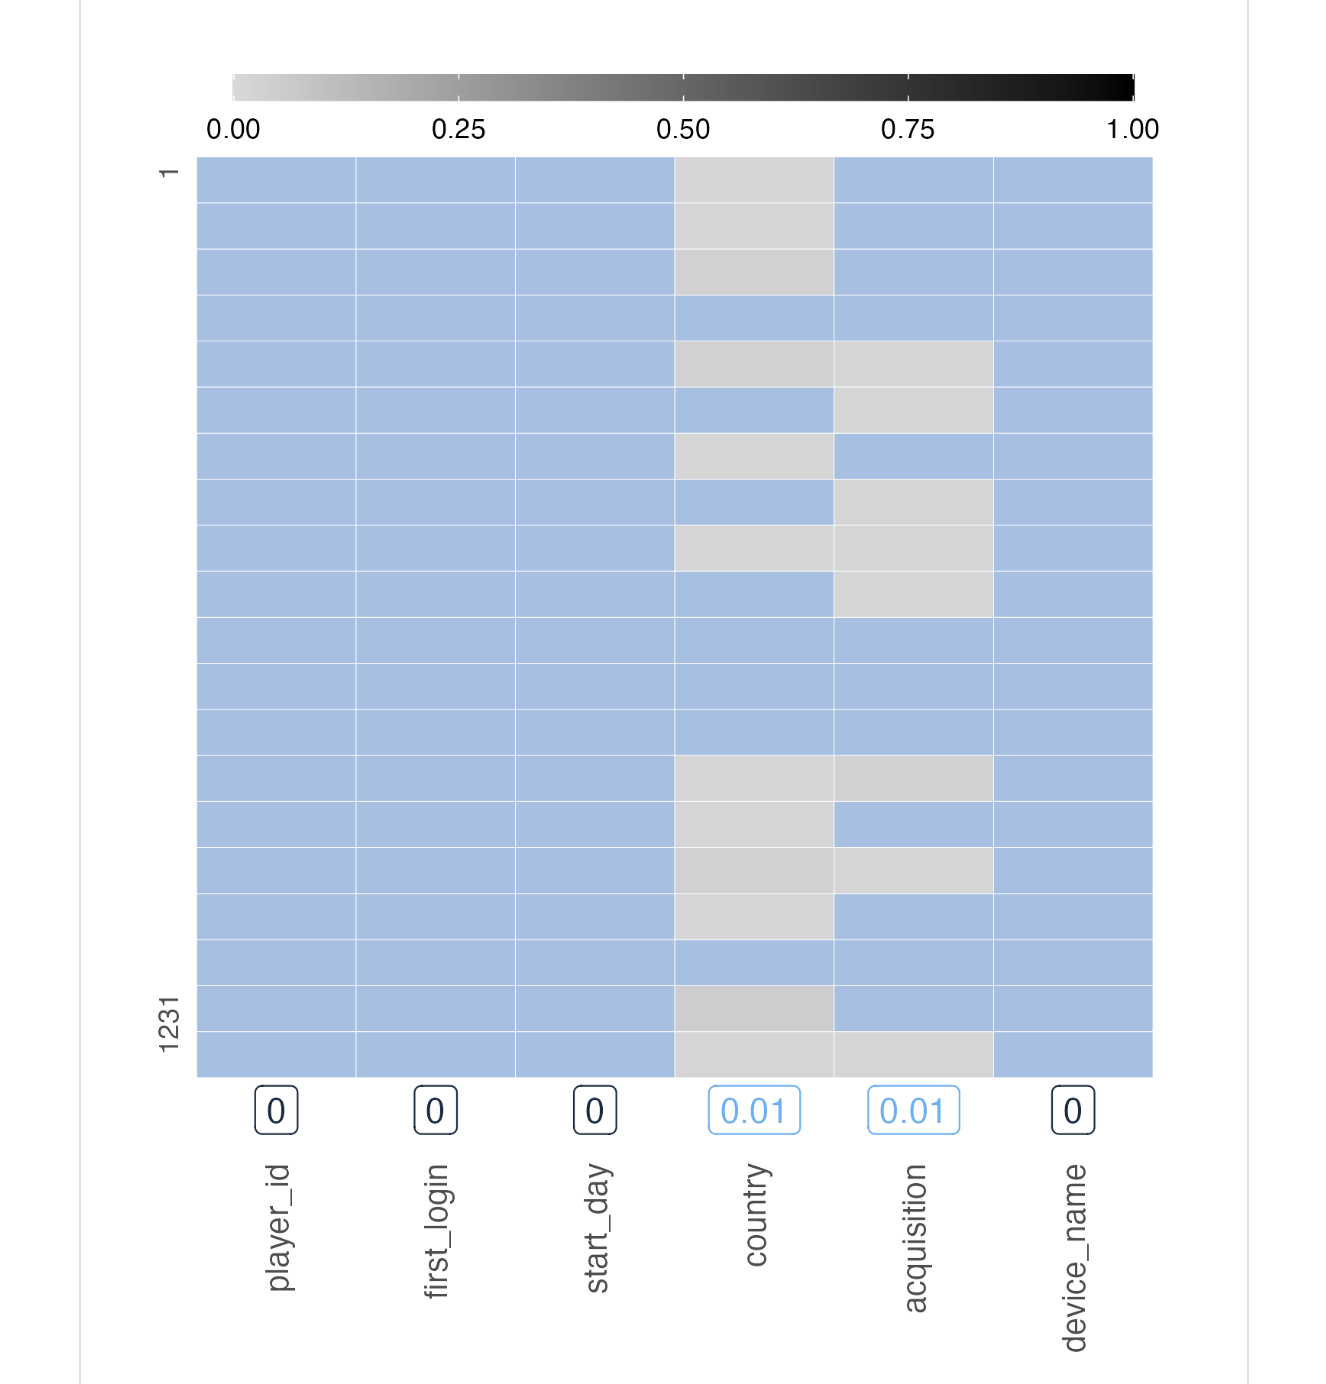
That already is bad data detected through a useful summary. By moving down to the Missing Values section we see that the missing data is entirely found in the country and acquisition columns. (This is the sort of good information to have when speaking to your data provider; they can potentially fix the problem.)
Part of the table scan, where we see if and where data is missing.
The next thing to do is look at the summary details for each of the columns. For player_id, we seem to have completely distinct values, and, that’s expected (the data dictionary says they should be unique). The string lengths are always 15 characters, so, that’s a good sign as well. We don’t get information in the table scan that tells us whether the IDs are formed as expected from the data dictionary (“12 uppercase letters followed by 3 digits”). We’ll check for that later.
The next two columns (first_login and start_day columns) are "datetime"- and "date"-type columns. This is corroborated in the data dictionary. There’s nothing yet to be suspicious about for these two columns.
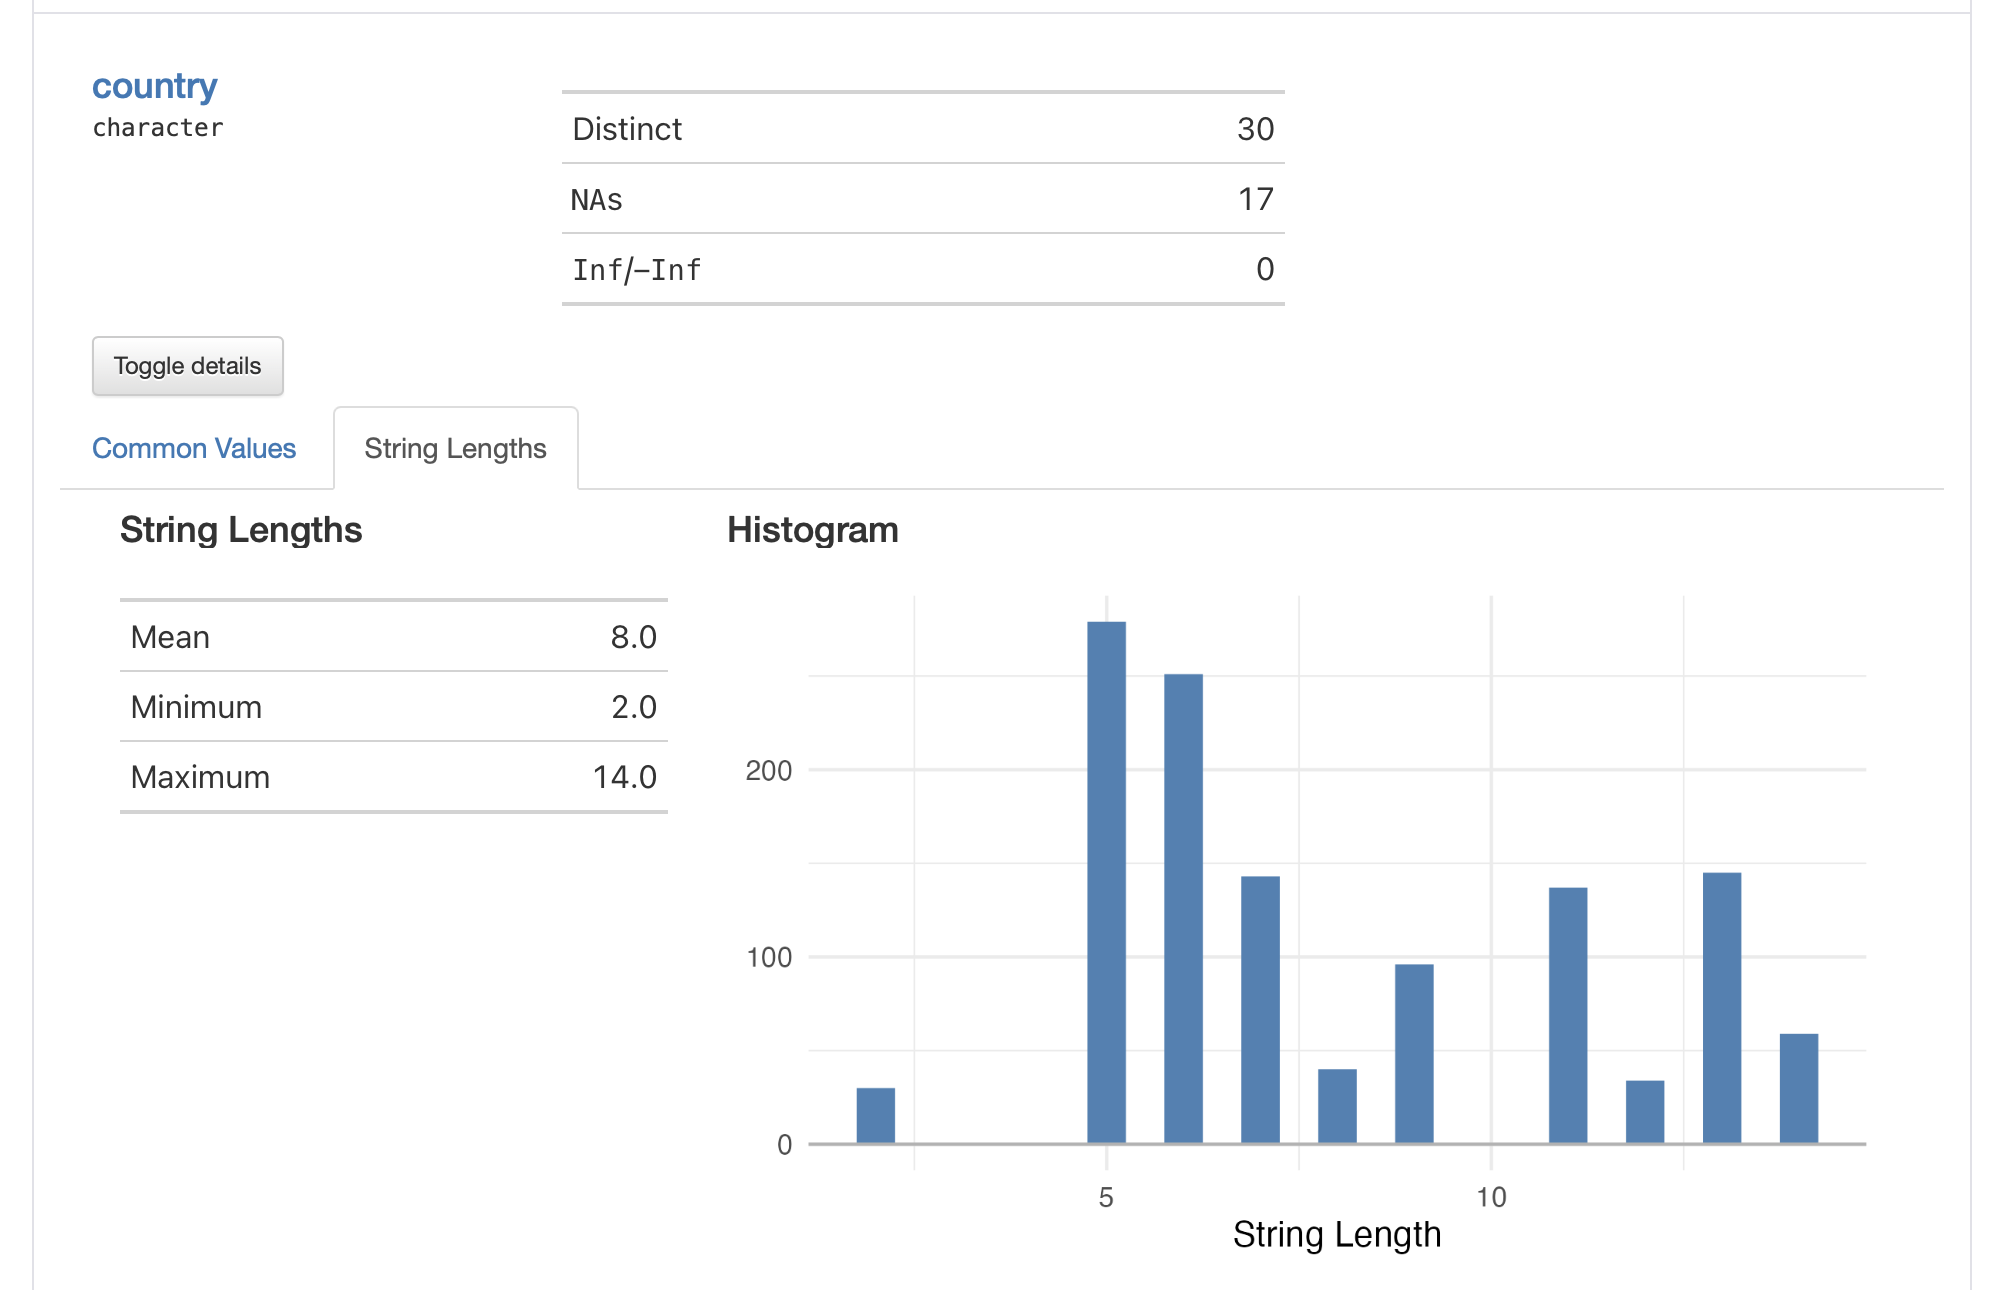
The country column, which we already know is problematic since is has NA values, should logically contain country names. The data dictionary doesn’t say much about how country names are represented in the data. In the Common Values subsection of the table scan for country, we say common values written as "United States", "China", "France", etc. Not the greatest practice, since there are more standardized ways of identifying a country. When looking at the String Lengths subsection we can see something a bit odd: minimum string values of 2. Since no country names written in English are as small as two characters, something else is amiss. We’ll check this further!
Part of the table scan, showing the proportions of string lengths for text in the country column.
For the acquisition column, aside from the NA values that ought not to be there, there seems to be nothing out of the ordinary when drilling down into that column’s summary values.
The device_name column looks fine, and the device names seem to be written out in a semi-standardized style. There are literally hundreds of distinct values here so we have to see if the formatting convention holds.
That concludes our scan of the table scan! We got some leads from it and we’ll be extra sure to check for those suspected problems and look for data anomalies. It’s a good idea always to save the report to disk using the export_report() function. Such table scan snapshots are useful to have around while formulating data quality checks.
6.3 Understand
One really cool thing you can do with pointblank (the package that’s all about data quality checks) is use a function called draft_validation(). Executing that with the dataset gives you an .R script with a ton of data quality statements written for you! You run it like this
and you get a .R file that looks like this
library(pointblank)agent<-create_agent( tbl =~user_summary, actions =action_levels( warn_at =0.05, stop_at =0.10), tbl_name ="User Summary", label ="Validation plan generated by `draft_validation()`.")%>%# Expect that column `player_id` is of type: charactercol_is_character( columns =vars(player_id))%>%# Expect that column `country` is of type: charactercol_is_character( columns =vars(country))%>%# Expect that values in `country` should be in the set of `NA`, `United States`, `Japan` (and 27 more)col_vals_in_set( columns =vars(country), set =c(NA, "United States", "Japan", "Switzerland", "China", "Denmark", "Hong Kong", "South Africa", "United Kingdom", "Austria", "India", "Portugal", "Russia", "Philippines", "South Korea", "Spain", "Germany", "Canada", "Egypt", "France", "Norway", "Mexico", "DK", "DE", "PH", "HK", "Australia", "Sweden", "CH", "NO"))%>%# Expect that column `acquisition` is of type: charactercol_is_character( columns =vars(acquisition))%>%# Expect that column `device_name` is of type: charactercol_is_character( columns =vars(device_name))%>%# Expect entirely distinct rows across all columnsrows_distinct()%>%# Expect that column schemas matchcol_schema_match( schema =col_schema( player_id ="character", first_login =c("POSIXct", "POSIXt"), start_day ="Date", country ="character", acquisition ="character", device_name ="character"))%>%interrogate()agent
This ‘draft validation’ is named as such because it gives you a starting point that isn’t necessarily correct (i.e., the parameters will need tweaking to fit the notions of valid data values), but, it will completely succeed. The underlying routine assumes all data values are correct and the validation statements are fit to the supplied data.
Let’s copy these agent-based workflow statements (removing the comments). A few additions should be added:
all rows should be complete
all columns should not have any NA values
add check for country names
ensure that player_id values are well formed
check that dates/datetimes represent occurrences in 2015
On point 3, recall that the country names were suspect? Looking at the set value used in the col_vals_in_set() statement, we can see that there are a few two-letter country names in the mix (that’s simply not right). We’ll have to change the way we check that column. Maybe the most prudent way to check for this error happening in the future is to check for a string length of at least four (this could guard against three-letter country codes erroneously entered in this column). Really, a closed set may not be ideal since more countries may enter the column on a data refresh/update (and that’s valid).
Here’s the complete validation plan, including the pointblank interrogation:
We can print the agent report by calling the agent object.
agent
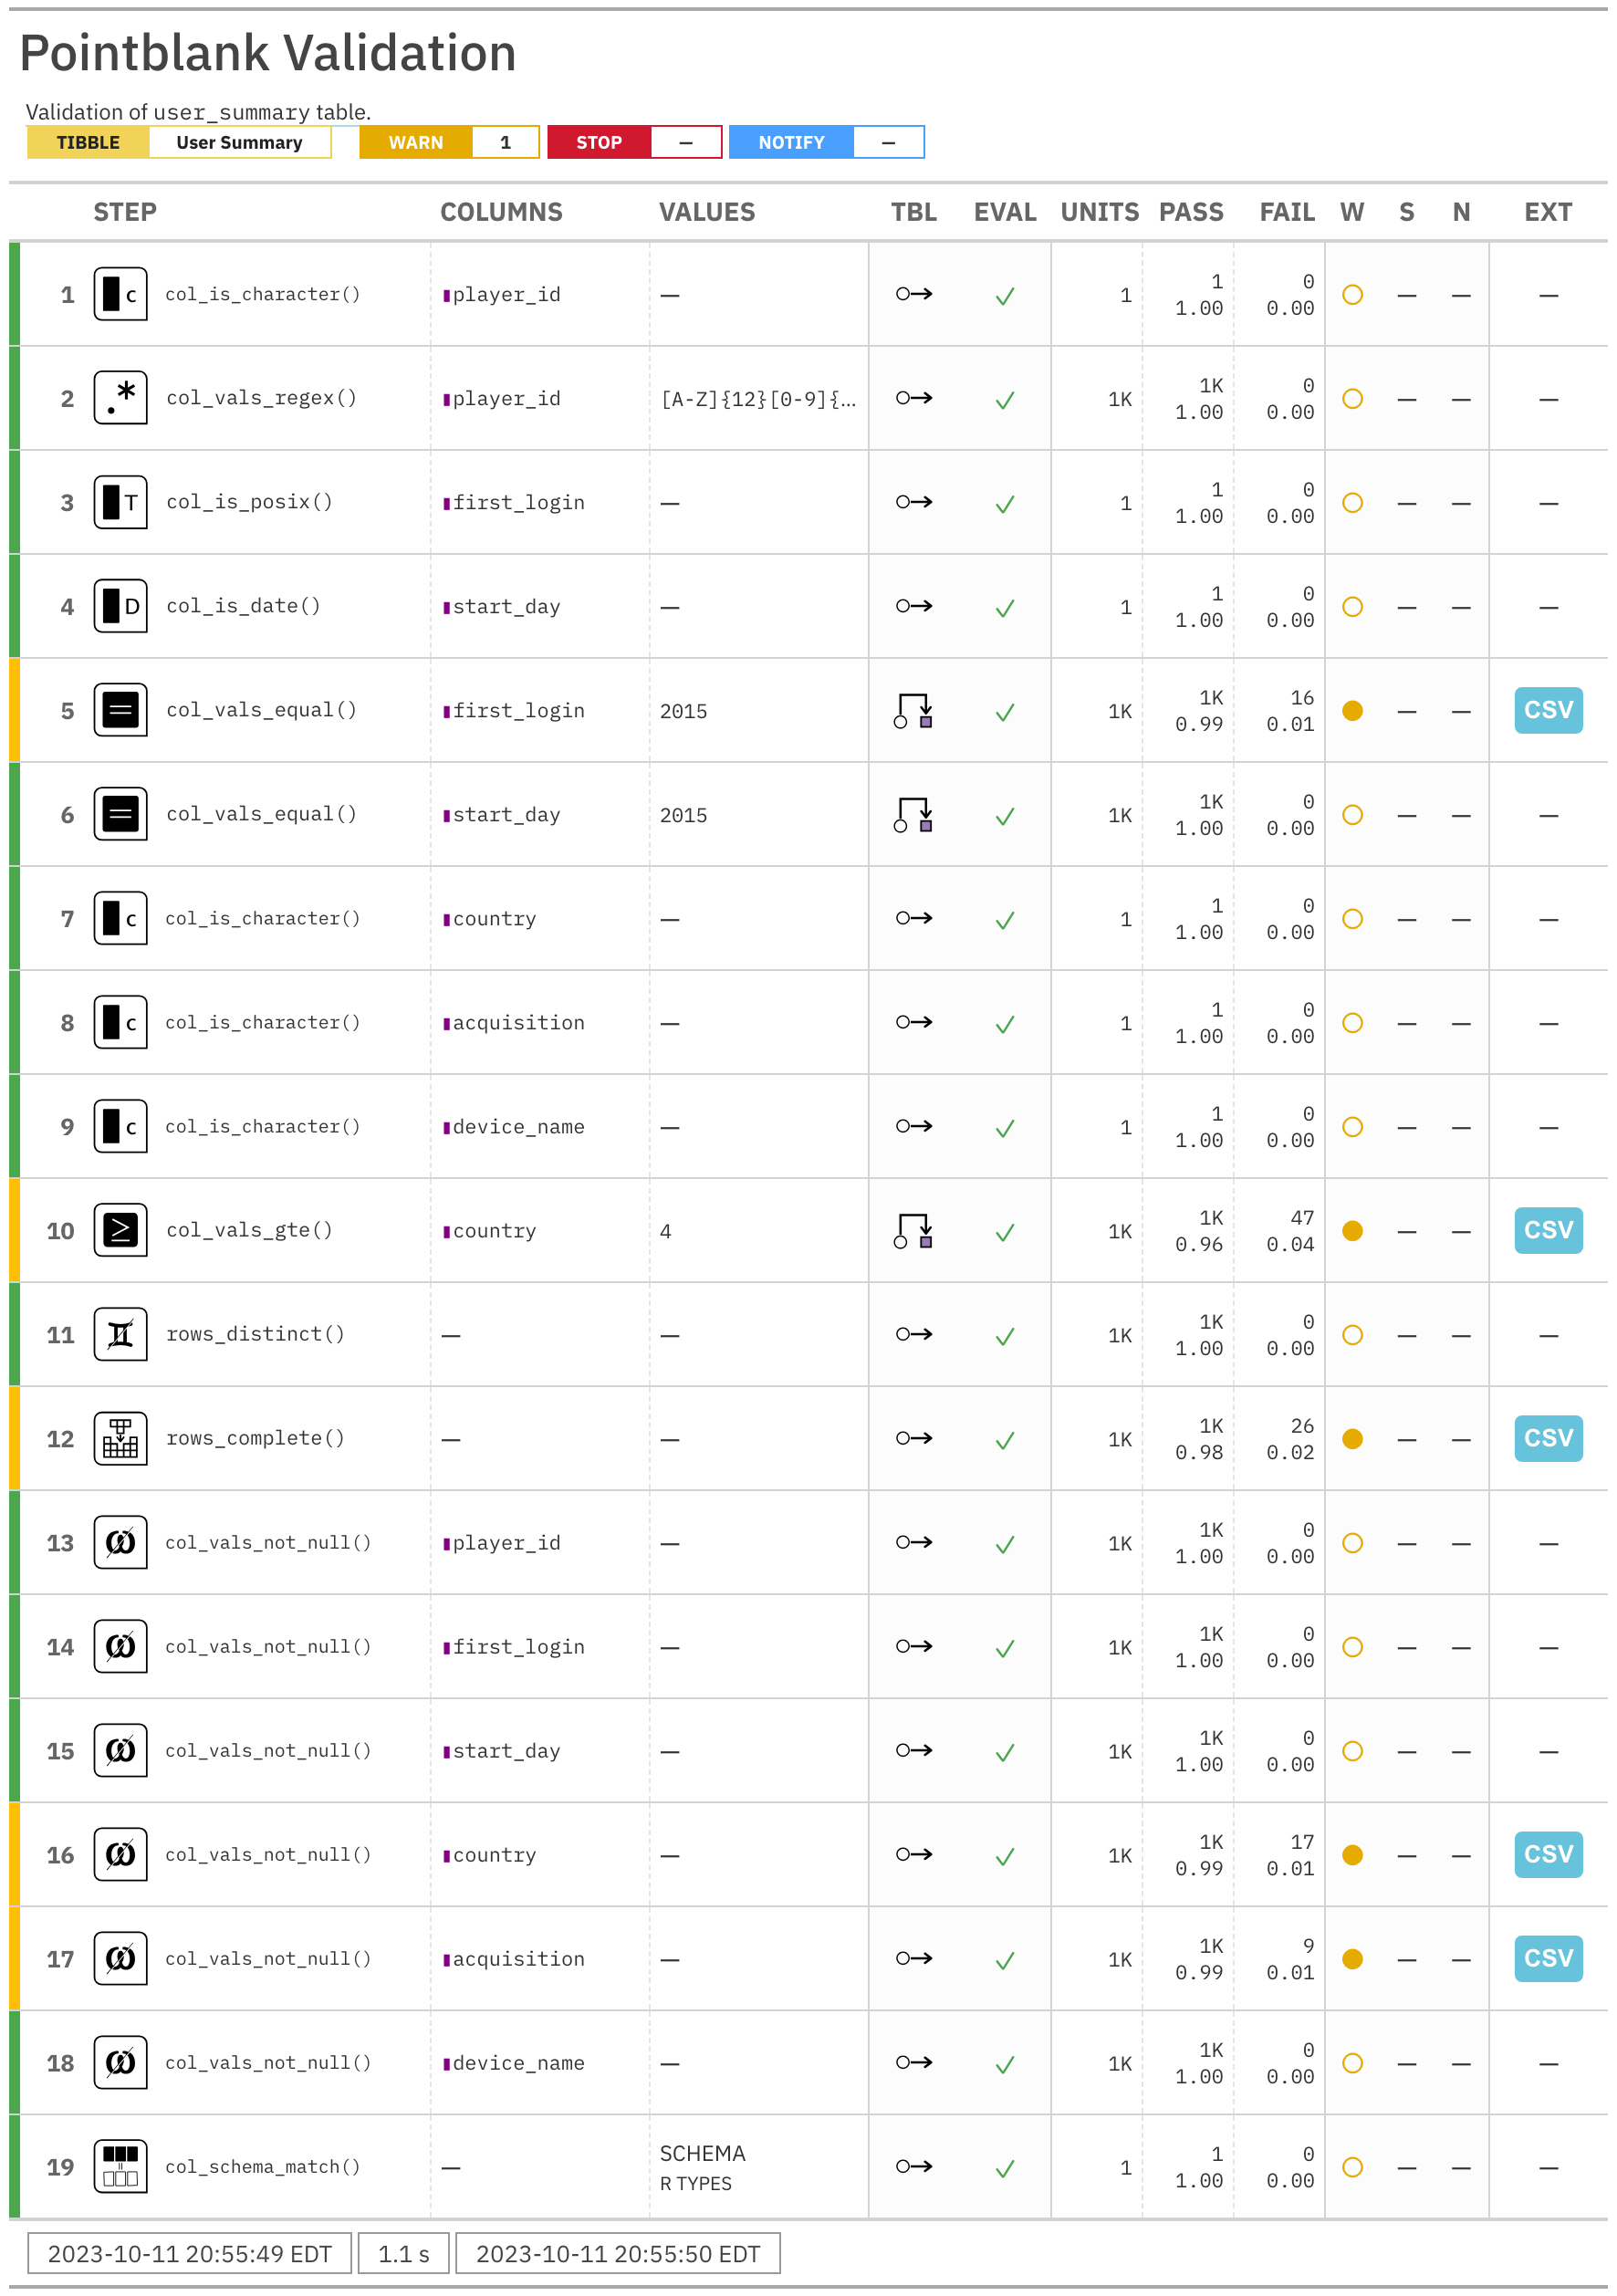
The agent report. It’s big and that’s because we validated really hard.
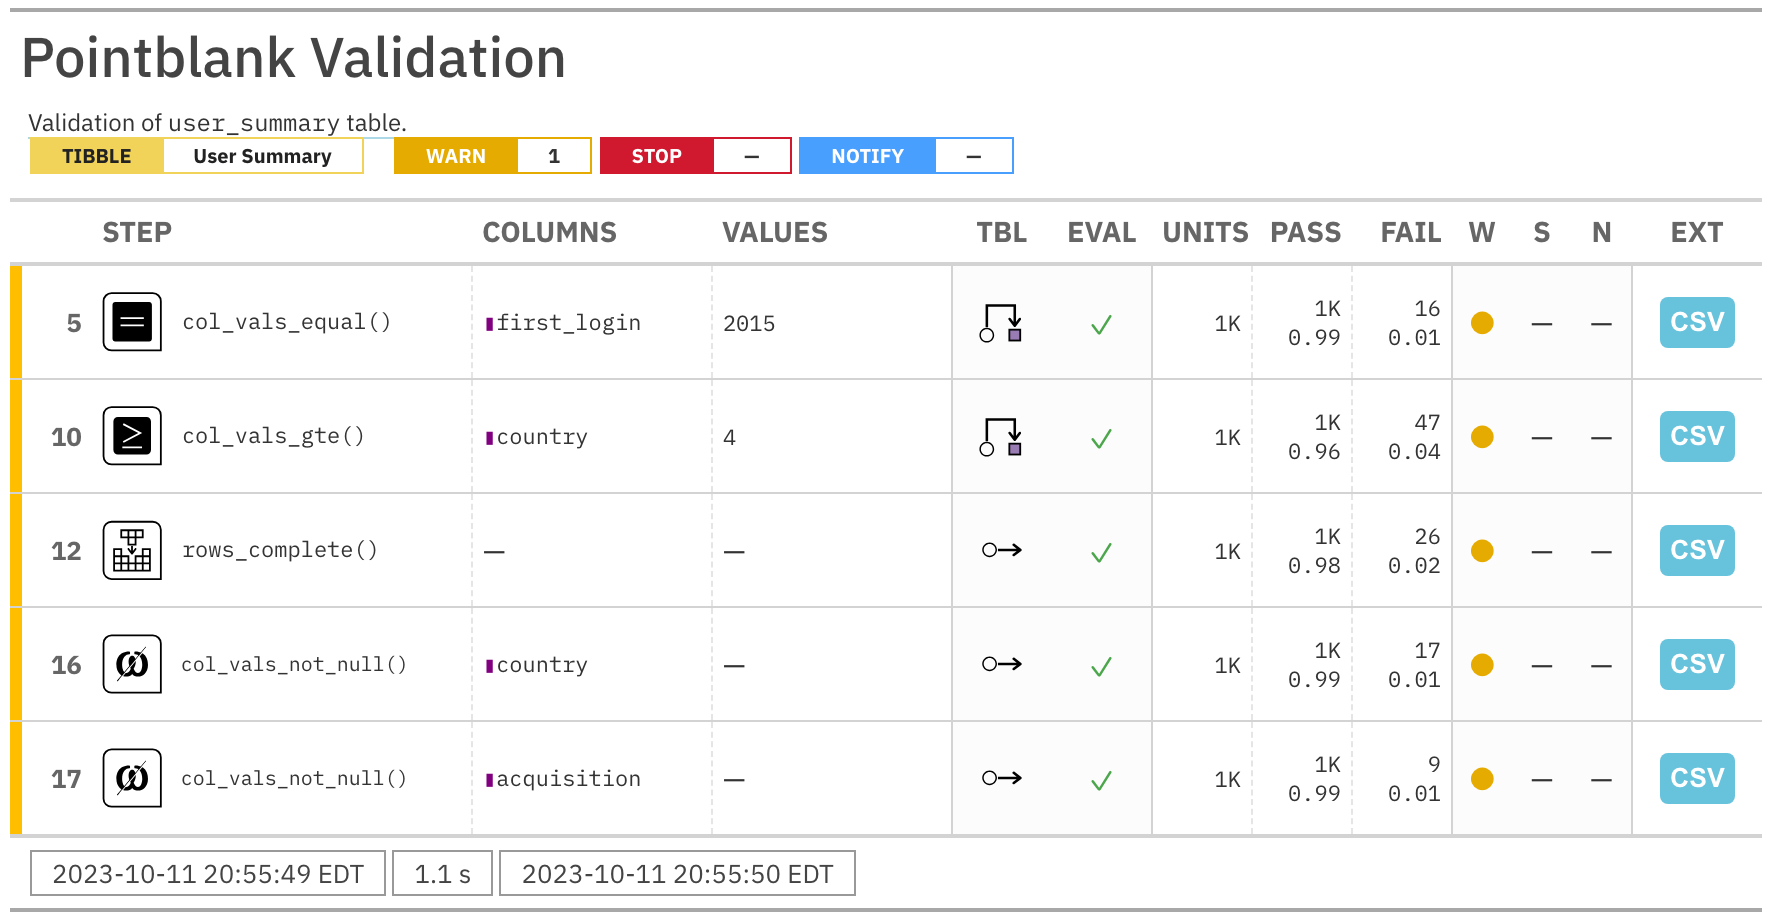
The validation report is a damning indictment of the data within user_summary. We can identify four separate data issues with this report. It’s possible to isolate only the problematic steps
The part of the agent report that tells us what’s not so good.
There are issues with the first_login datetime values (16 units failing), the values within country (47 failures), and the country and acquistion columns have NAs (17 and 9, respectively). Knowledge of data being faulty and knowing where it is faulty is quite valuable. Only then will you have a chance to rectify the data generation process or at least know which portions of the data can be less trusted.
It’s good to know if there are upstream processes you don’t have access to when it comes to the data you’re given. If it’s truly raw data, then you can expect that the existing data won’t change (new data might be added but existing data won’t be mutated). However, if this data has been subject to treatments before being given to you, then that process is a bit out of your hands. However, you can improve these processes by checking data and pointing out anomalies that your data provider might have missed (or didn’t check for). In doing so, the provider might improve the data transformation process and you get better (i.e., less anomalous) data.
6.4 Explain
We ought to get a workflow in order to continually test datasets of this type. The common scenario is that the table should data much the same in terms of shape, structure, and intent, but it will be updated with new data and older records may be updated/corrected as well. Because we now have a pointblank validation plan that successfully ran with interrogate(), we could use that every time the data is updated.
An R script to set this all up might look like this:
library(tidyverse)# for data manipulation functionslibrary(pointblank)# for performing data quality checkslibrary(intendo)# for the data itself# Obtain the updated datauser_summary<-user_summary(quality ="faulty")# Get the current date and timereport_time<-Sys.time()# Create a pointblank agent, include several validation steps# to exhaustively test the data, and interrogate the data# with the `interrogate()` functionagent<-create_agent( tbl =~user_summary, actions =action_levels(warn_at =1), tbl_name ="User Summary", label =paste("Validation of `user_summary` table on", report_time))|>col_is_character( columns =vars(player_id))|>col_vals_regex( columns =vars(player_id), regex ="[A-Z]{12}[0-9]{3}")|>col_is_posix(columns =vars(first_login))|>col_is_date(columns =vars(start_day))|>col_vals_equal( columns =vars(first_login), value ="2015", preconditions =function(x){dplyr::mutate(x, first_login =substr(first_login, 1, 4))})|>col_vals_equal( columns =vars(start_day), value ="2015", preconditions =function(x){dplyr::mutate(x, start_day =substr(start_day, 1, 4))})|>col_is_character(columns =vars(country, acquisition, device_name))|>col_vals_gte( columns =vars(country), value =4, preconditions =function(x)dplyr::mutate(x, country =nchar(country)))|>rows_distinct()|>rows_complete()|>col_vals_not_null(columns =everything())|>col_schema_match( schema =col_schema( player_id ="character", first_login =c("POSIXct", "POSIXt"), start_day ="Date", country ="character", acquisition ="character", device_name ="character"))|>interrogate()# Customize the reporting of the agent by adding# a title and by arranging the validation steps# in order of 'severity' (steps with failing units# are shown first)agent_report<-get_agent_report(agent, title ="Data Quality Report", arrange_by ="severity")# Save the agent reporting as an HTML file on disk;# include the date and time of running the validation# checks so that we have an ongoing record that sorts# nicely in a directoryexport_report(agent_report, filename =affix_datetime("user_summary-data-quality-report.html"))# Write a YAML file that captures all of the# data validation instructions in YAML formyaml_write(agent, filename =affix_datetime("user_summary-data-quality-inputs.yml"))
We did a few extra things in this script in order to have some additional file artifacts stored in the working directory. First, we customized the agent report with the get_agent_report() function (and we assigned it to a new variable called agent_report). We can export that to a standalone HTML file with pointblank’s export_report() function (and we did, in the script above). We also did an extra thing which was to write a YAML file containing all of the pointblank validation instructions. This is a great-to-have bit of record-keeping for your data validation pattern. Within the script, we made sure to document the intent of each statement (with comments located above the relevant statements).
This .R script (could be a .qmd: your choice) organizes this workflow so you can easily keep on top of anything that may compromise data quality for this dataset. If you have multiple datasets to check, they can be part of the same .R/.qmd and it could be run once (checking lots more data, generating way more files). With what is currently set up here, we can react quickly to data problems and provide some evidence of the data issues to data providers/producers, thanks to the artifacts generated by the script.
We also made sure that the reporting is organized with timestamps in as many places as possible. You might imagine a situation where the data quality checking is running every day on many datasets. With a huge volume of files, we really need an audit trail that clearly identifies the date and time of each check. The filenames have this datetime information (the affix_datetime() utility function in pointblank makes this easy) and the HTML reports each have the date and time embedded within (top and bottom of each!). The last thing you want is a disorganization of artifacts but the strategy laid out here is a good one to follow.
6.5 Share
Suppose you need to share an excerpt of the user_summary dataset but you know the data quality of it has issues. Thankfully, pointblank has a function for separating the ‘good’ data from the ‘bad’. It’s the get_sundered_data() function. Let’s see how it works with a very small data quality check of user_summary (using only the col_vals_not_null() validation function).
The get_sundered_data() function will, by default, return a slice of the data consisting of rows that didn’t have any failing test units. So, the complete_rows table will only contain rows where there weren’t any NA values. Let’s look at it:
complete_rows
# A tibble: 1,205 × 6
   player_id      first_login         start_day  country acquisition device_name
   <chr>          <dttm>              <date>     <chr>   <chr>       <chr>
 1 YMKOHGVFZWLJ8… 2015-01-01 01:45:33 2015-01-01 United… organic     Samsung Ga…
 2 SBPFOHCVMNQI5… 2015-01-01 10:13:16 2015-01-01 Japan   apple       Sony Exper…
 3 DLCKJEZRSIGW5… 2015-01-02 14:16:25 2015-01-02 United… organic     Sony Exper…
 4 RNWFDZOSQPMB1… 2015-01-03 07:14:57 2015-01-03 Switze… google      Sony Exper…
 5 SOBKUJPREVCZ8… 2015-01-03 09:15:56 2015-01-03 China   apple       iPad mini
 6 LKCUQHXDRWAZ1… 2015-01-03 09:29:00 2015-01-03 China   facebook    2nd Gen iP…
 7 TDRXCWIOZEYM2… 2015-01-03 12:58:30 2015-01-03 Denmark other_camp… 3rd Gen iP…
 8 NKBLRWVXIYJZ8… 2015-01-04 00:01:14 2015-01-04 Hong K… apple       sonyexperi…
 9 IYOPSWCHJBRA4… 2015-01-04 02:16:15 2015-01-04 South … google      4th Gen iP…
10 OPGNMSIAQCFX4… 2015-01-04 22:26:26 2015-01-04 United… organic     Samsung Ga…
# ℹ 1,195 more rows
Of course, a printing of the tibble won’t assure us that there aren’t any rows with NAs in them. We can use the test_*() variant of the rows_complete() function to give us a TRUE or a FALSE.
If you want to check this table even more and be sure that the column schema hasn’t changed, we can use test_col_schema_match() function. We’ll compare the schema of the new table (complete_rows) with that of the source table (user_summary). If we get TRUE that means the the column names are the same, they’re in the correct order, and they have the same types.
To make that table-to-table comparison we had to use the col_schema() helper function and feed in the comparison table (which, again, is user_summary). But the really important thing is that we get TRUE returned to us. Now we can be confident that the complete_rows table is a filtered version of user_summary.
How you share this vitally-important data, perhaps needed for an important analysis of some sort? Here are two ways, because options are good.
The readr package, did you know?, also can write files? It’s true, the write_csv() function can be used for saving tibbles or data frames as CSV files. This function offers improved performance (and better defaults) compared to the base R write.csv() function.
Is the person you’re sharing the file with using R? If ‘yes’, then sending them an RDS file is a pretty good option. Plus, all of the column types will be preserved faithfully within this format! We can use readr’s write_rds() function for this:
So, we’ve double-checked that the complete_rows data is complete, a subset of the user_summary table, and now it’s a file of some sort (either .csv or .rds). Now you can send it in the way that is most convenient, like email, in a message, or dropping the file somewhere in a shared file storage system.